Compare the partner states
Six ways to compare the eight EAC partner states, from public data with its year and source.
Side by side
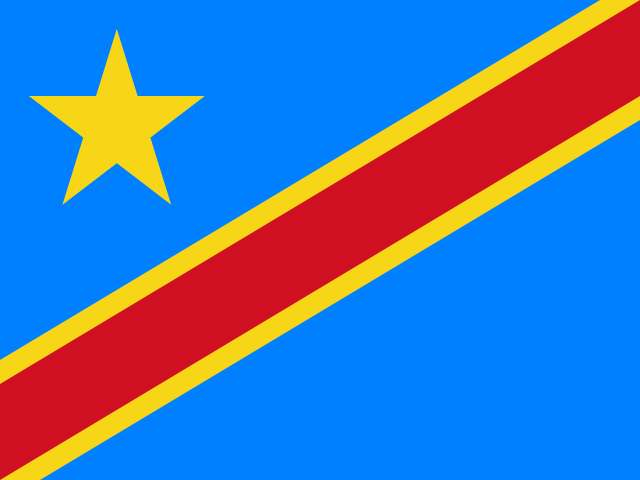 DR Congo |
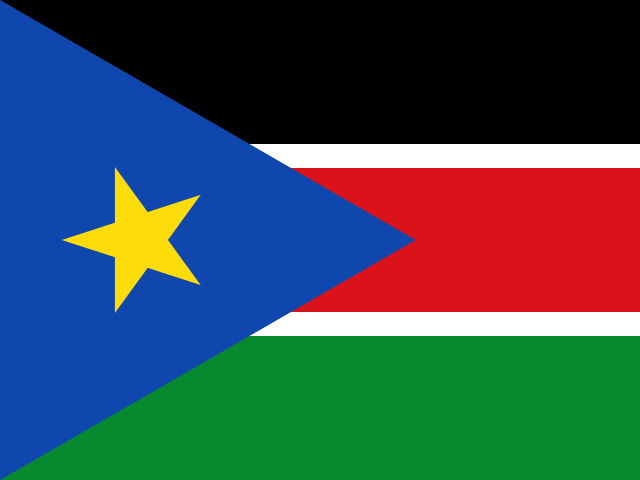 South Sudan |
|
|---|---|---|
| EconomyWorld Bank WDI | ||
| GDP | $91.0 bn2025 2 of 8 | $12.0 bn2015 7 of 8 |
| GDP per capita | $8072025 5 of 7 | Not reported |
| GDP growth | 5.8 %2025 4 of 7 | Not reported |
| Population | 113 M2025 1 of 8 | 12.2 M2025 8 of 8 |
| Inflation | Not reported | 91.4 %2024 1 of 6 |
| Trade, % of GDP | 87.3 %2025 2 of 7 | 65.6 %2015 3 of 7 |
| Exports of goods and services | $39.5 bn2025 1 of 7 | $4.4 bn2015 5 of 7 |
| Trade in goodsUN Comtrade, as reported by each state | ||
| Goods exports | $40.4 bn2025 1 of 7 | $3.3 bn2025 5 of 7 |
| Goods imports | $13.9 bn2025 4 of 7 | $868.1 m2025 7 of 7 |
| Exports going to the EAC | 4.9 %2025 6 of 7 | 0.7 %2025 7 of 7 |
| On MyEASOKO and All Business AfricaMyEASOKO (live), World Bank procurement, All Business Africa | ||
| Suppliers | 0 6 of 8 | 0 8 of 8 |
| Products | 0 6 of 8 | 0 8 of 8 |
| Open buyer requests | 0 6 of 8 | 0 8 of 8 |
| Open World Bank tenders | 15 3 of 8 | 0 8 of 8 |
| Open tenders and calls | 0 8 of 8 | 5 7 of 8 |
| Investors | 0 6 of 8 | 0 8 of 8 |